The CPU is the most important component of your computer. All applications and system services will need to utilize the CPU in order to run. Your Linux operating system will make a determination on how to divide its CPU resources across all of the various programs that are competing to use it.
In this tutorial, you will learn how to monitor your Linux system’s CPU usage.
Using top Command
The top command is installed by default on all Linux desktops and servers. It gives us a basic overview of the apps and services running on our system, and sorts them by their CPU usage.
$ top
Look for the %CPU column to see how many CPU resources each process is consuming. You can see in our screenshot that gnome-shell is using the most resources on our system, at 7.6% CPU usage.
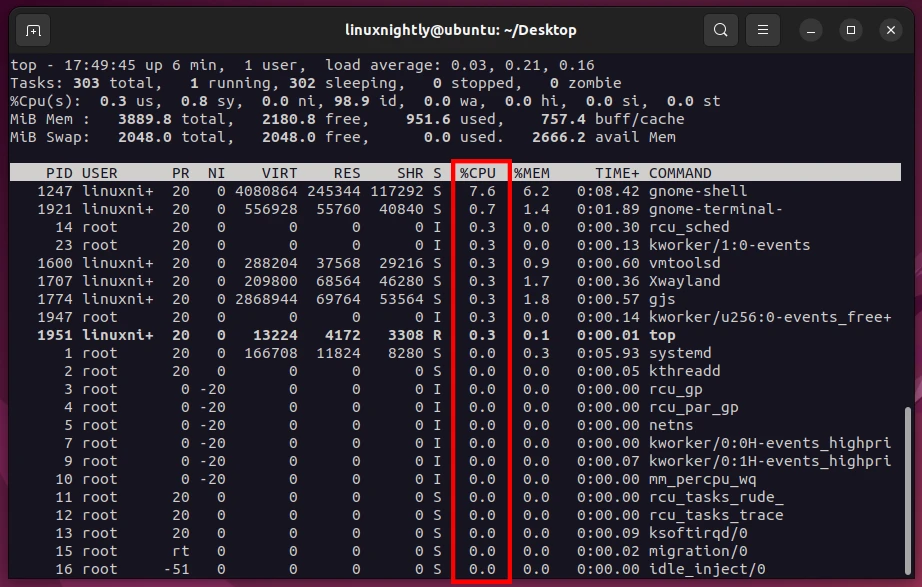
Use key t to cycle through different views offered by top. To exit from top, just press q.
At the top of the top output, you will also find the system’s load average.
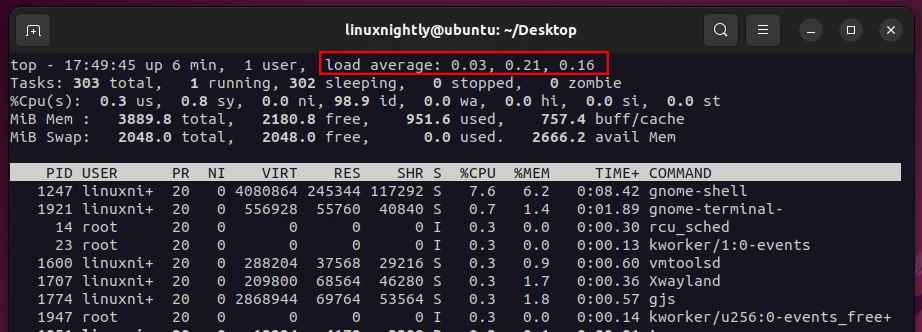
On our system, we have:
load average: 0.03, 0.21, 0.16
These numbers are the load average of our CPU over the last 1 minute, 5 minutes, and 15 minutes, respectively. The numbers represent percentages, so 0.5 would be 50% and 1.0 would be 100%. In our case, we have 3% CPU usage over the last minute, 21% usage averaged over the last 5 minutes, and 16% usage averaged over the last 15 minutes.
Keep in mind that sometimes these load averages can exceed 1.0 (100%). That’s because top is reporting on how much load the CPU is trying to process. Numbers over 1.0 indicate that the CPU is being overloaded.
The next bit to pay attention to is the %Cpu(s) row.
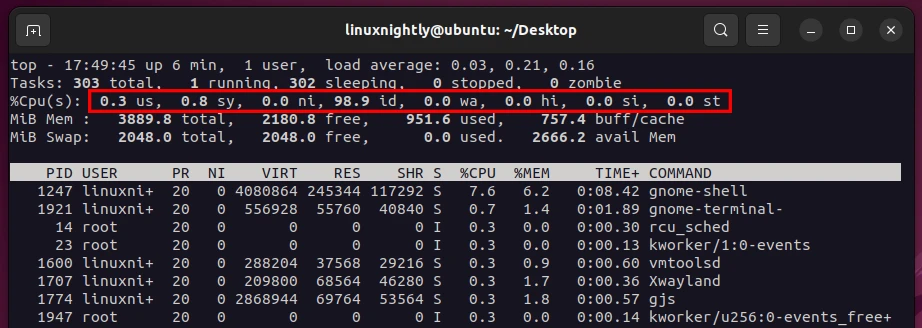
In our example, we have:
%Cpu(s): 0.3 us, 0.8 sy, 0.0 ni, 98.9 id, 0.0 wa, 0.0 hi, 0.0 si, 0.0 st
These values are percentages. Here’s a breakdown of what the abbreviations mean:
us: Time spent in user space (e.g., processing user-spawned apps/programs).sy: Time spent in kernel space (e.g., processing kernel, extensions, drivers, etc).ni: Time spent on processes with a nice value (e.g., a process with a manually overridden CPU priority).id: Time spent idlewa: Time spent waiting on I/O from system hardware (e.g., waiting for RAM to finish writing to disk).hi: Time spent on hardware interrupts (e.g., a network card alerting the CPU of new data).si: Time spent on software interrupts (e.g., a service with high priority interrupting the CPU).st: Time spent to steal resources from a virtual machine (e.g., repurposing CPU resources from a VM to process the host machine’s load).
Using htop Command
The htop command is another favorite of system administrators, but it’s not always installed by default. It works similarly to top, but is a lot easier to interpret even with a brief glance.
To install htop:
$ sudo apt install htop # Debian/Ubuntu
$ sudo dnf install htop # Fedora/Alma/Rocky/CentOS
$ sudo pacman -S htop # Arch Linux / Manjaro
Once installation is done, simply run the command:
$ htop
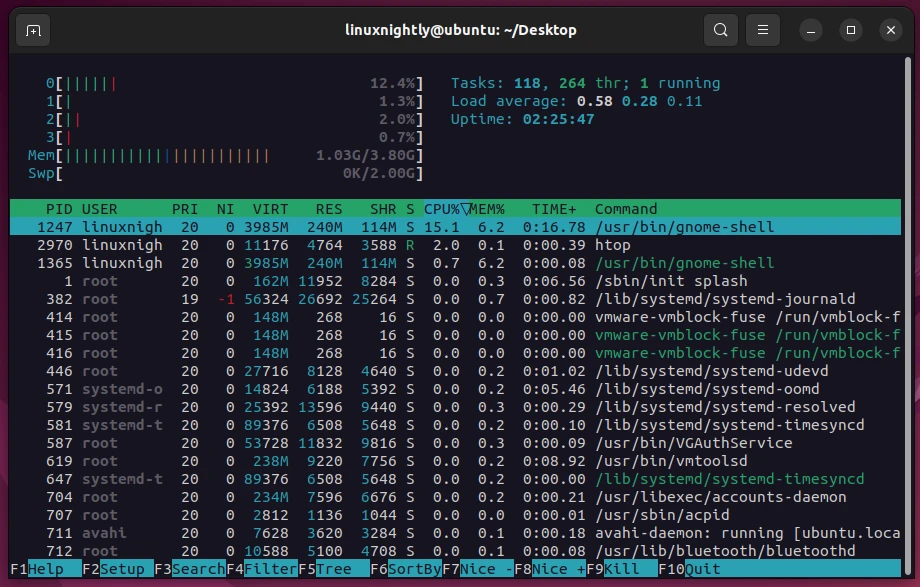
At the top of the output, you can see that htop shows the usage for each processor core. Our system has four cores (0-3). Similar to top, you’ll also see the load average and a list of processes which are using the most CPU.
You can interact with htop by using your mouse. There’s also a list of keyboard shortcuts shown at the bottom of the screen. To quit out of htop, just press q.
Using mpstat, sar, and iostat
The sysstat software package contains three tools mpstat, sar, and iostat that we can use to check CPU usage. To install sysstat:
$ sudo apt install sysstat # Debian/Ubuntu
$ sudo dnf install sysstat # Fedora/Alma/Rocky/CentOS
$ sudo pacman -S sysstat # Arch Linux / Manjaro
sar command
The sar command will output your total CPU usage in one line. It will accept two numbers as arguments. The first number is how often it should output the current CPU usage, and the second line is how many times it should repeat until stopping.
Example 1. To show the CPU usage every 4 seconds, for a total of 5 times:
$ sar 4 5
Output from sar:
Linux 5.15.0-52-generic (ubuntu) 	10/31/2022 	_x86_64_	(4 CPU)

01:42:30 PM     CPU     %user     %nice   %system   %iowait    %steal     %idle
01:42:34 PM     all     18.61      0.00     13.70      2.93      0.00     64.75
01:42:38 PM     all     13.27      0.00     24.51      9.16      0.00     53.06
01:42:42 PM     all     27.79      0.06     22.21      4.11      0.00     45.83
01:42:46 PM     all     40.80      0.00     22.13      1.96      0.00     35.10
01:42:50 PM     all     40.59      0.00     22.69      0.97      0.00     35.75
Average:        all     28.08      0.01     21.04      3.85      0.00     47.01
As you can see, sar will output the percentage of CPU resources spent on user space, nice priorities, system processes, I/O wait time, stolen resources from VM, and how much is left over (idle).
Example 2. To make sar output continuously until interrupted (by Ctrl + C for example), only put one number in your command (how often you want the output to occur). This example will make sar output continuously every 1 second:
$ sar 1
mpstat command
Example 1. The mpstat command gives a granular breakdown of how the CPU resources are being used across your system.
$ mpstat
Output from mpstat:
$ mpstat
Linux 5.15.0-52-generic (ubuntu) 	10/31/2022 	_x86_64_	(4 CPU)

01:50:51 PM  CPU    %usr   %nice    %sys %iowait    %irq   %soft  %steal  %guest  %gnice   %idle
01:50:51 PM  all    0.26    0.03    0.23    0.03    0.00    0.03    0.00    0.00    0.00   99.43
%usr: Percentage of CPU spent on user level apps%nice: Percentage of CPU spent on processes with a nice priority%sys: Percentage of CPU spent on system processes%iowait: Percentage of CPU spent waiting on disk I/O%irq: Percentage of CPU spent on hardware interrupts%soft: Percentage of CPU spent on software interrupts%steal: Percentage of CPU stolen from hypervisor%guest: Percentage of CPU spent on guest processes (VMs)%gnice: Percentage of CPU spent on a niced guest%idle: Percentage of the CPU that is idle
Example 2. To make mpstat continuously probe the CPU and produce new output, just append a number to the command. This command will instruct mpstat to produce new output every 2 seconds:
$ mpstat 2
iostat command
Example 1. The iostat command will show average CPU usage, as well as current disk usage.
$ iostat
Output from iostat:
Linux 5.15.0-52-generic (ubuntu) 	10/31/2022 	_x86_64_	(4 CPU)

avg-cpu:  %user   %nice %system %iowait  %steal   %idle
           0.26    0.02    0.26    0.03    0.00   99.43

Device             tps    kB_read/s    kB_wrtn/s    kB_dscd/s    kB_read    kB_wrtn    kB_dscd
sda               3.09       101.85        43.27         0.00    1089629     462905          0
Example 2. To make iostat continuously probe the CPU (and disks) and produce new output, just append a number to the command. This command will instruct iostat to produce new output every 2 seconds:
$ iostat 2
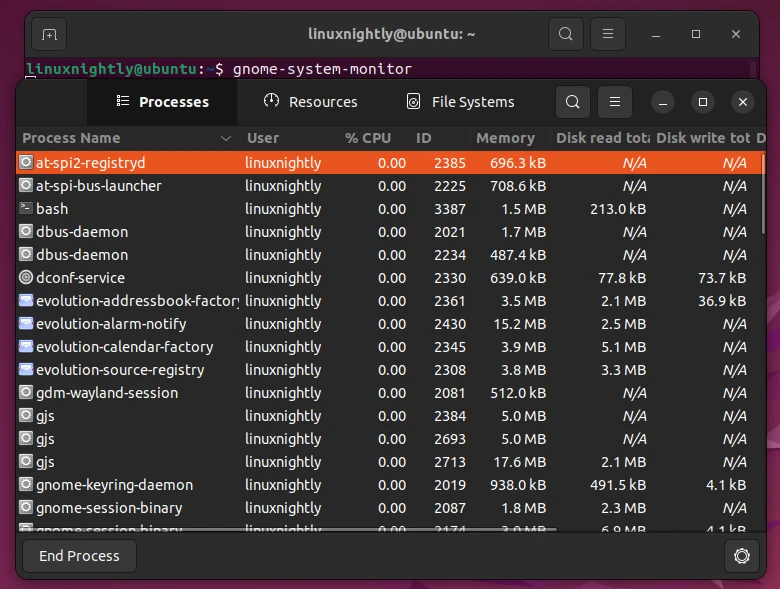
Monitor CPU Usage via GUI
The GNOME System Monitor application is a great way to monitor CPU usage from GUI. You don’t need to use GNOME desktop in order to run the app. In case you don’t already have it, here’s how to install it:
$ sudo apt install gnome-system-monitor # Debian/Ubuntu
$ sudo dnf install gnome-system-monitor # Fedora/Alma/Rocky/CentOS
$ sudo pacman -S gnome-system-monitor # Arch Linux / Manjaro
Then open the application or launch from terminal:
$ gnome-system-monitor
Showing list of processes and their CPU usage:
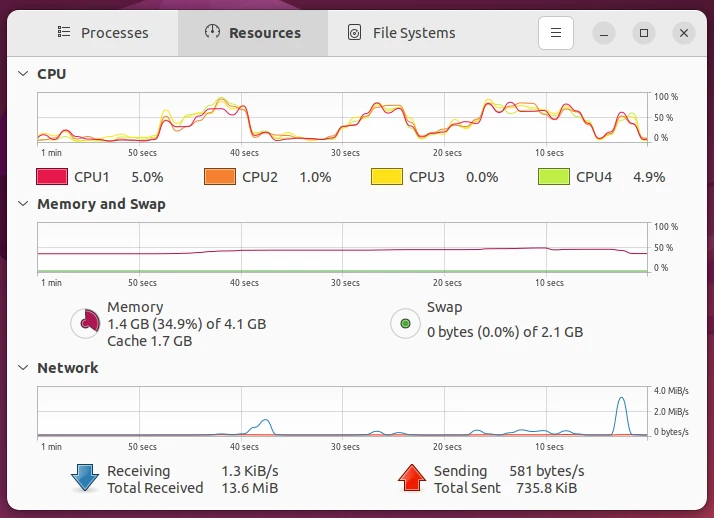
Showing graph of CPU usage over time: